AI agent observability: one JSONL line per verb
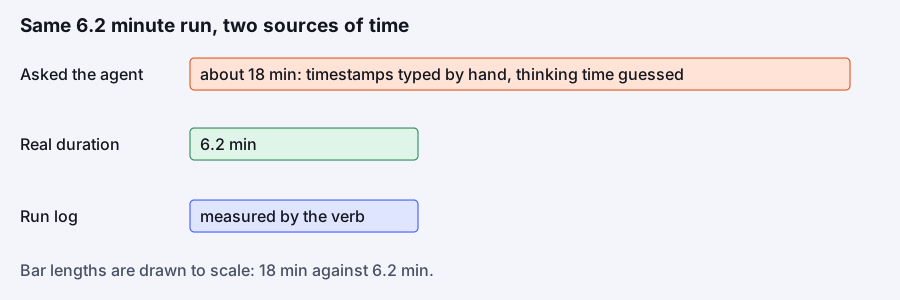
On 2026-10-04 we asked an agent to log how long each step of a 6.2 minute task took. It handed back a table that summed to about 18 minutes. The agent had run date once, typed the other timestamps by hand and guessed its own thinking time. It told us so, but the numbers still looked like measurements. That was the day we stopped asking agents for durations and started building AI agent observability into the tool: one JSONL line for every verb the agent runs.
The problem: we could not see where the time went
vawe renders films from HTML pages, and a session has many slow steps: draft renders, a final render that takes minutes and a queue of render slots shared by every agent on the laptop. By late September we could not answer plain questions. Which step was slow? Which calls failed, and why? Did the second draft fix anything the first one flagged?
The run log we had was thin. In one trace review of a tracking-HUD session the log held 21 lines for 162 tool calls. strip, frames, compare, velocity, onion, critique and audio left no record at all. A failed or killed draft wrote nothing. An early version of vawe runs printed "judge -" for every draft. Time spent waiting for a render slot sat inside the draft's wall time with no field of its own.
What we tried first
Asking the agent. It failed the way the opening paragraph says. A language model has no clock while it thinks, and it sees time only in tool output. If you ask for durations it estimates them and then reports the estimate in the same format as a measurement. We wrote that down as a rule: ask an agent for what it saw and decided, never for how long something took.
The other tool we had was the agent transcript. Timestamps from each tool call to its result give real durations, and we used them in trace reviews. But a transcript is a separate file in a different format per client, and nobody reads one before the next run.
What we built
The log has two layers, added nine days apart.
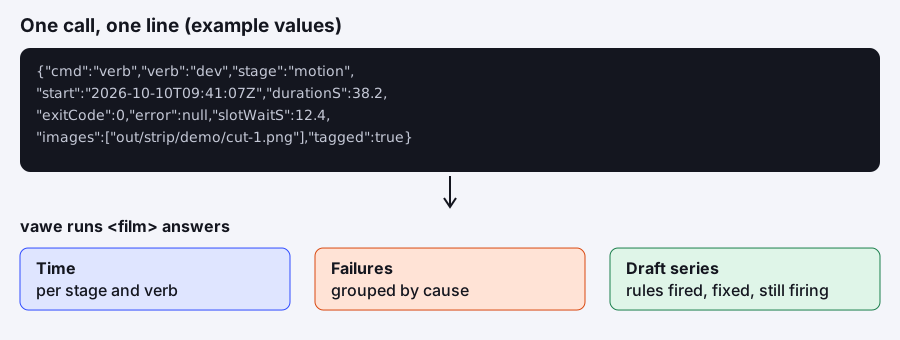
97bf133 (2026-10-01) wrote one event per step for new, dev, judge and ship, added vawe runs, and put the ship job logs under out/ship-jobs. 914f16f (2026-10-10) made the log cover every verb. A call now appends one line to out/<film>.runs.jsonl with these fields: the verb and its arguments, the stage the film was in when the call started, a start time, the duration in seconds, the exit code, the error reason, how long the call waited for a render slot, and the images it printed. A tagged field says whether the run named an agent through VAWE_AGENT, so a report can tell a stray untagged run from the agent's own.
The verb itself measures all of that. A child script reports facts such as the slot wait to the main process through a small notes file. The agent writes nothing, so the agent cannot get it wrong.
The same commit added the footer that ends every call with vawe: dev ok in 38.2s or vawe: dev FAILED (reason) in 38.2s (see one binary, one verb per step for why). The failure reasons are grouped by cause in vawe runs, so "render slot or navigation timeout" and "browser lost" show up as counts and not as 40 different strings.
vawe runs <film> answers three questions: where the time went per stage and verb, what failed and why, and the draft series. vawe runs --all gives one row per film for the last 30 days. vawe runs --taste reports, per rule, how often it fired, how often it was fixed and how often it still fired in the next draft (6cb5227, and 1560a60 restored the per-draft lines).
What the log showed
The log paid for itself in the first weeks, in places we did not plan.
- The docs audit used it as data. The
rules_firedfield in the logs covered 377devruns over 59 films, so we could say which rules fired most and which never did, instead of guessing which docs to keep. - In one trace review, 9 of 12 later drafts fixed no rule that the earlier draft had fired. That is a draft loop that is not converging. Before the log we could only suspect it; after, we could count it, and it fed the work on what the agent measures against.
- A review of a design-systems session found that 52 of 130 shell calls were polls of
ship --status --wait, and that three of five final renders failed and cost 2,967 seconds, 49 minutes and 45 percent of that session. Two of the failures were already fully captured and died at the last step. Slot waits had been invisible until the log recorded them.
None of those numbers came from asking an agent. They came from a log file and transcript timestamps.
What we would tell you if you build the same thing
Let the tool write the log and keep the agent out of the loop. Log every call, including the ones that fail, because a log that only records success hides what you most want to see. Record the exit code and the reason on the line, so a pipe to tail in the agent's command cannot hide a failure from your report. Add a field for any wait that is not work, such as a queue, because it will be a large part of the total and will look like slowness in the tool. Give the log a reader command, since a JSONL nobody reads is storage and not observability.
Last, expect to read the log with a transcript beside it. The log tells you which call took 38 seconds. The transcript tells you what the agent was trying to do. The reading your film docs show the sibling idea for the film itself, and the troubleshooting page covers the failure causes the log groups.
In the code
harness/lib/runlog.mjsandharness/lib/verb-log.mjs: the event shape, the footer line and the failure causes.harness/lib/runs-report.mjsandharness/dev/runs.mjs: thevawe runsreport.bin/vawe: where each call is timed and logged.- Commits: 97bf133 (events for new, dev, judge, ship), 914f16f (every verb logged), 6cb5227 (taste report), 1560a60 (per-draft rule lines).