Chart build
When to use
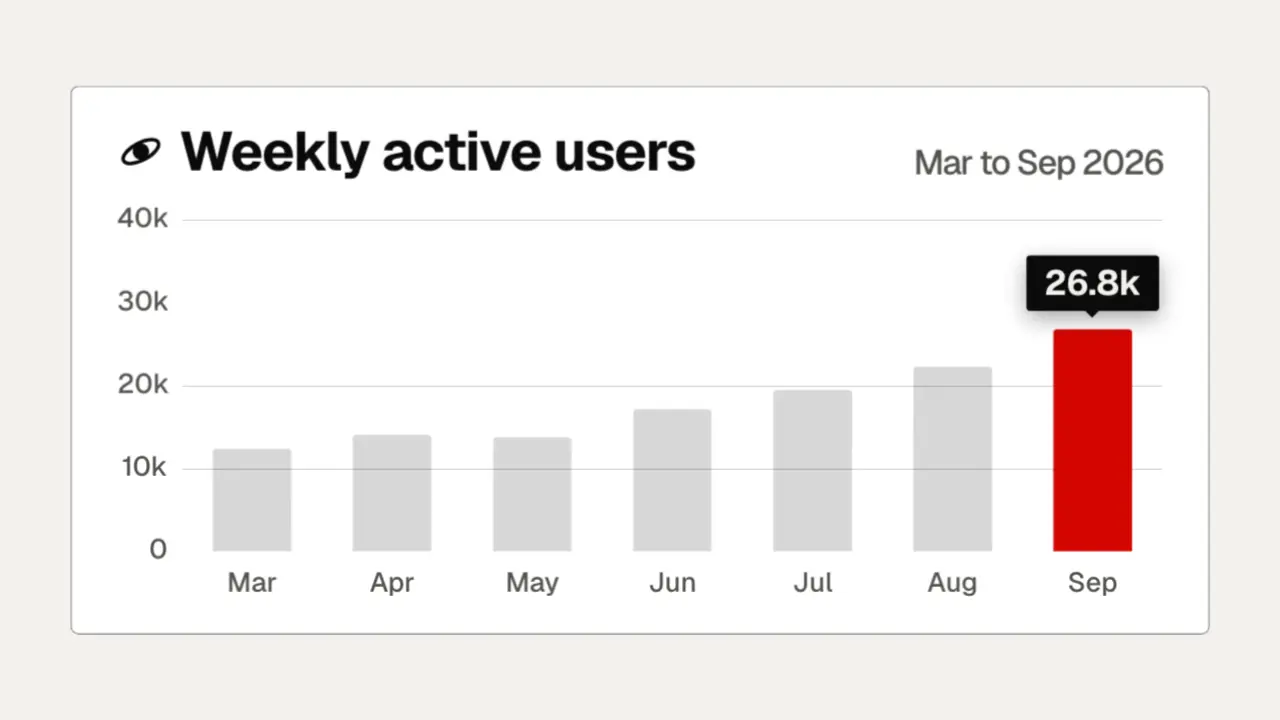
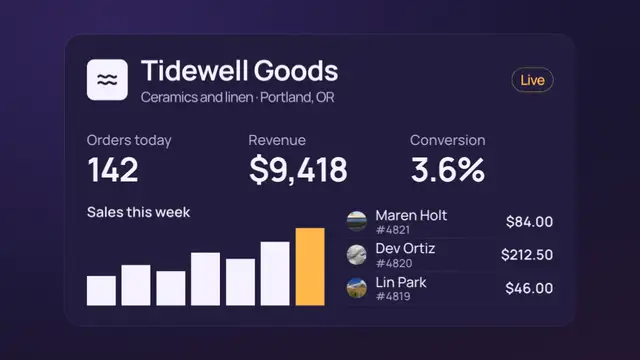
Use when a trend is the claim: growth, a launch month, a benchmark. The gridlines draw first, then the bars rise from the baseline 70 ms apart, all grey; the newest bar then turns accent and its value tag pops onto it. Only one bar and one number are bright, so the chart says one thing. Clip: chart-build.mp4. Demo: demo/chart-build.html.
The code
<div class="plot"><div class="grid"><span>10k</span></div> ... <div class="col"><div class="bar"></div><div class="mo">Mar</div></div> ...</div>
<style>
.bar { width: 62%; height: 0%; border-radius: 1.2vh 1.2vh 0 0; background: rgba(255,255,255,0.28); }
.grid { position: absolute; left: 0; right: 0; height: 1px; background: rgba(255,255,255,0.09); transform-origin: 0 50%; }
.tag { position: absolute; left: 50%; bottom: 100%; margin-bottom: 1.6vh; translate: -50% 0; background: #fff; color: #16151a; transform-origin: 50% 100%; opacity: 0; }
</style>
<script type="module">
import { EASE } from '../../core/motion/presets.js';
const max = 40;   // the axis top: above the tallest bar, or the tag collides with the header
grid.animate([{ scale: '0 1' }, { scale: '1 1' }], { duration: 500, delay: 60 + i * 40, easing: EASE.land, fill: 'both' });
bars.forEach((bar, i) => bar.animate([{ height: '0%' }, { height: `${(value[i] / max) * 100}%` }], { duration: 800, delay: 260 + i * 70, easing: EASE.land, fill: 'both' }));
last.animate([{ background: 'rgba(255,255,255,0.28)' }, { background: '#0a87ff' }], { duration: 240, delay: 1250, easing: 'linear', fill: 'both' });
tag.animate([{ scale: 0.85, translate: '-50% 1.6vh', opacity: 0 }, { scale: 1, translate: '-50% 0', opacity: 1 }], { duration: 650, delay: 1350, easing: EASE.pop, fill: 'both' });
</script>
Easing and timing
The clip runs 2 s. The look is swiss.
The clip uses 2 named eases from core/motion/presets.js. Each is a pair of After Effects handles: influence is how far along the segment the handle reaches, and speed is how fast the value moves at the key, as a multiple of the segment's average speed. Motion in the docs explains both.
| Ease | Leaving a key | Arriving at a key |
|---|---|---|
land | 12% influence, speed 4.8 | 75% influence, speed 0 |
pop | 12% influence, speed 4.8 | 35% influence, speed -1.5 |
Notes
The bars animate height, not scaleY, so the rounded top is never squashed on the way up. The 70 ms gap is inside the 30 to 80 ms band and reads as a left-to-right sweep. The data is real looking and rising (12.4k to 26.8k, monthly), and the axis labels are on the chart, because a chart without units is a decoration. The tag is white on the dark card, not accent, so the bar keeps the one accent. Turn the last bar on after the others land: a bar that is bright from its first frame draws the eye before there is a trend to read.
Looks (ground, type, radius, accent) live in demo/demo.css; this snippet keeps neutral tokens.
Sound
Sound: droplet at 1.35 s into the move, when the value tag pops on the accent bar (default gain); no tick per bar.
Related moves
See all 125 moves. Learn how a page becomes a film in the docs, copy chains of moves from the recipes, or read the motion guide.